


Overview
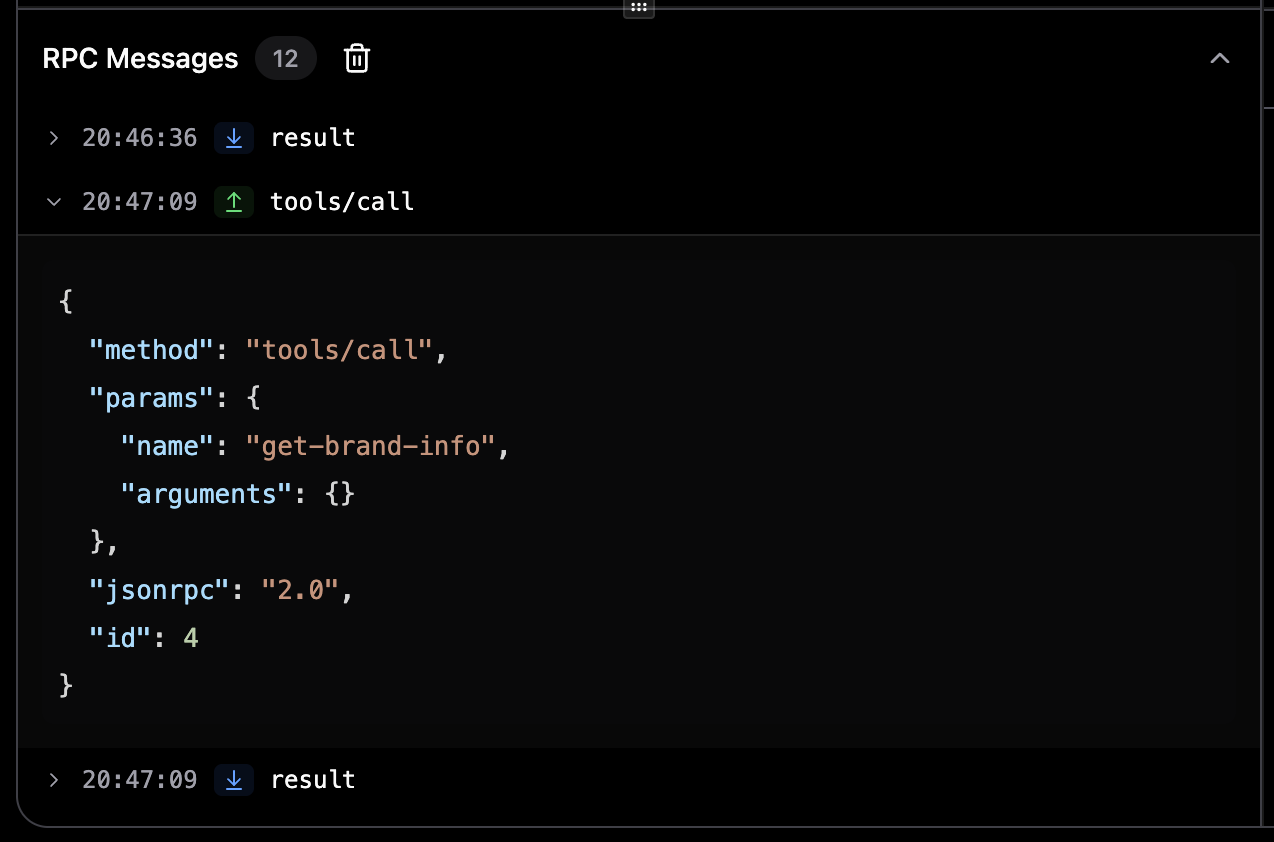
Expanded RPC message showing detailed JSON payload
What is RPC Logging?
RPC (Remote Procedure Call) logging captures every JSON-RPC message sent to and received from MCP servers. This includes:- Tool calls: Requests to execute tools and their responses
- Resource requests: Queries for resources and their results
- Prompt requests: Prompt execution requests and responses
- Notifications: Server-initiated notifications
- Errors: Error responses and connection issues
Opening the RPC Panel
1
Navigate to a Tab
Open the Tools, Resources, or Prompts tab for a connected server.
2
Locate RPC Panel
The RPC Messages panel appears at the bottom of the left sidebar. It starts collapsed by default.
3
Expand Panel
Click on the “RPC Messages” header to expand the panel. You can resize it by dragging the handle above it.
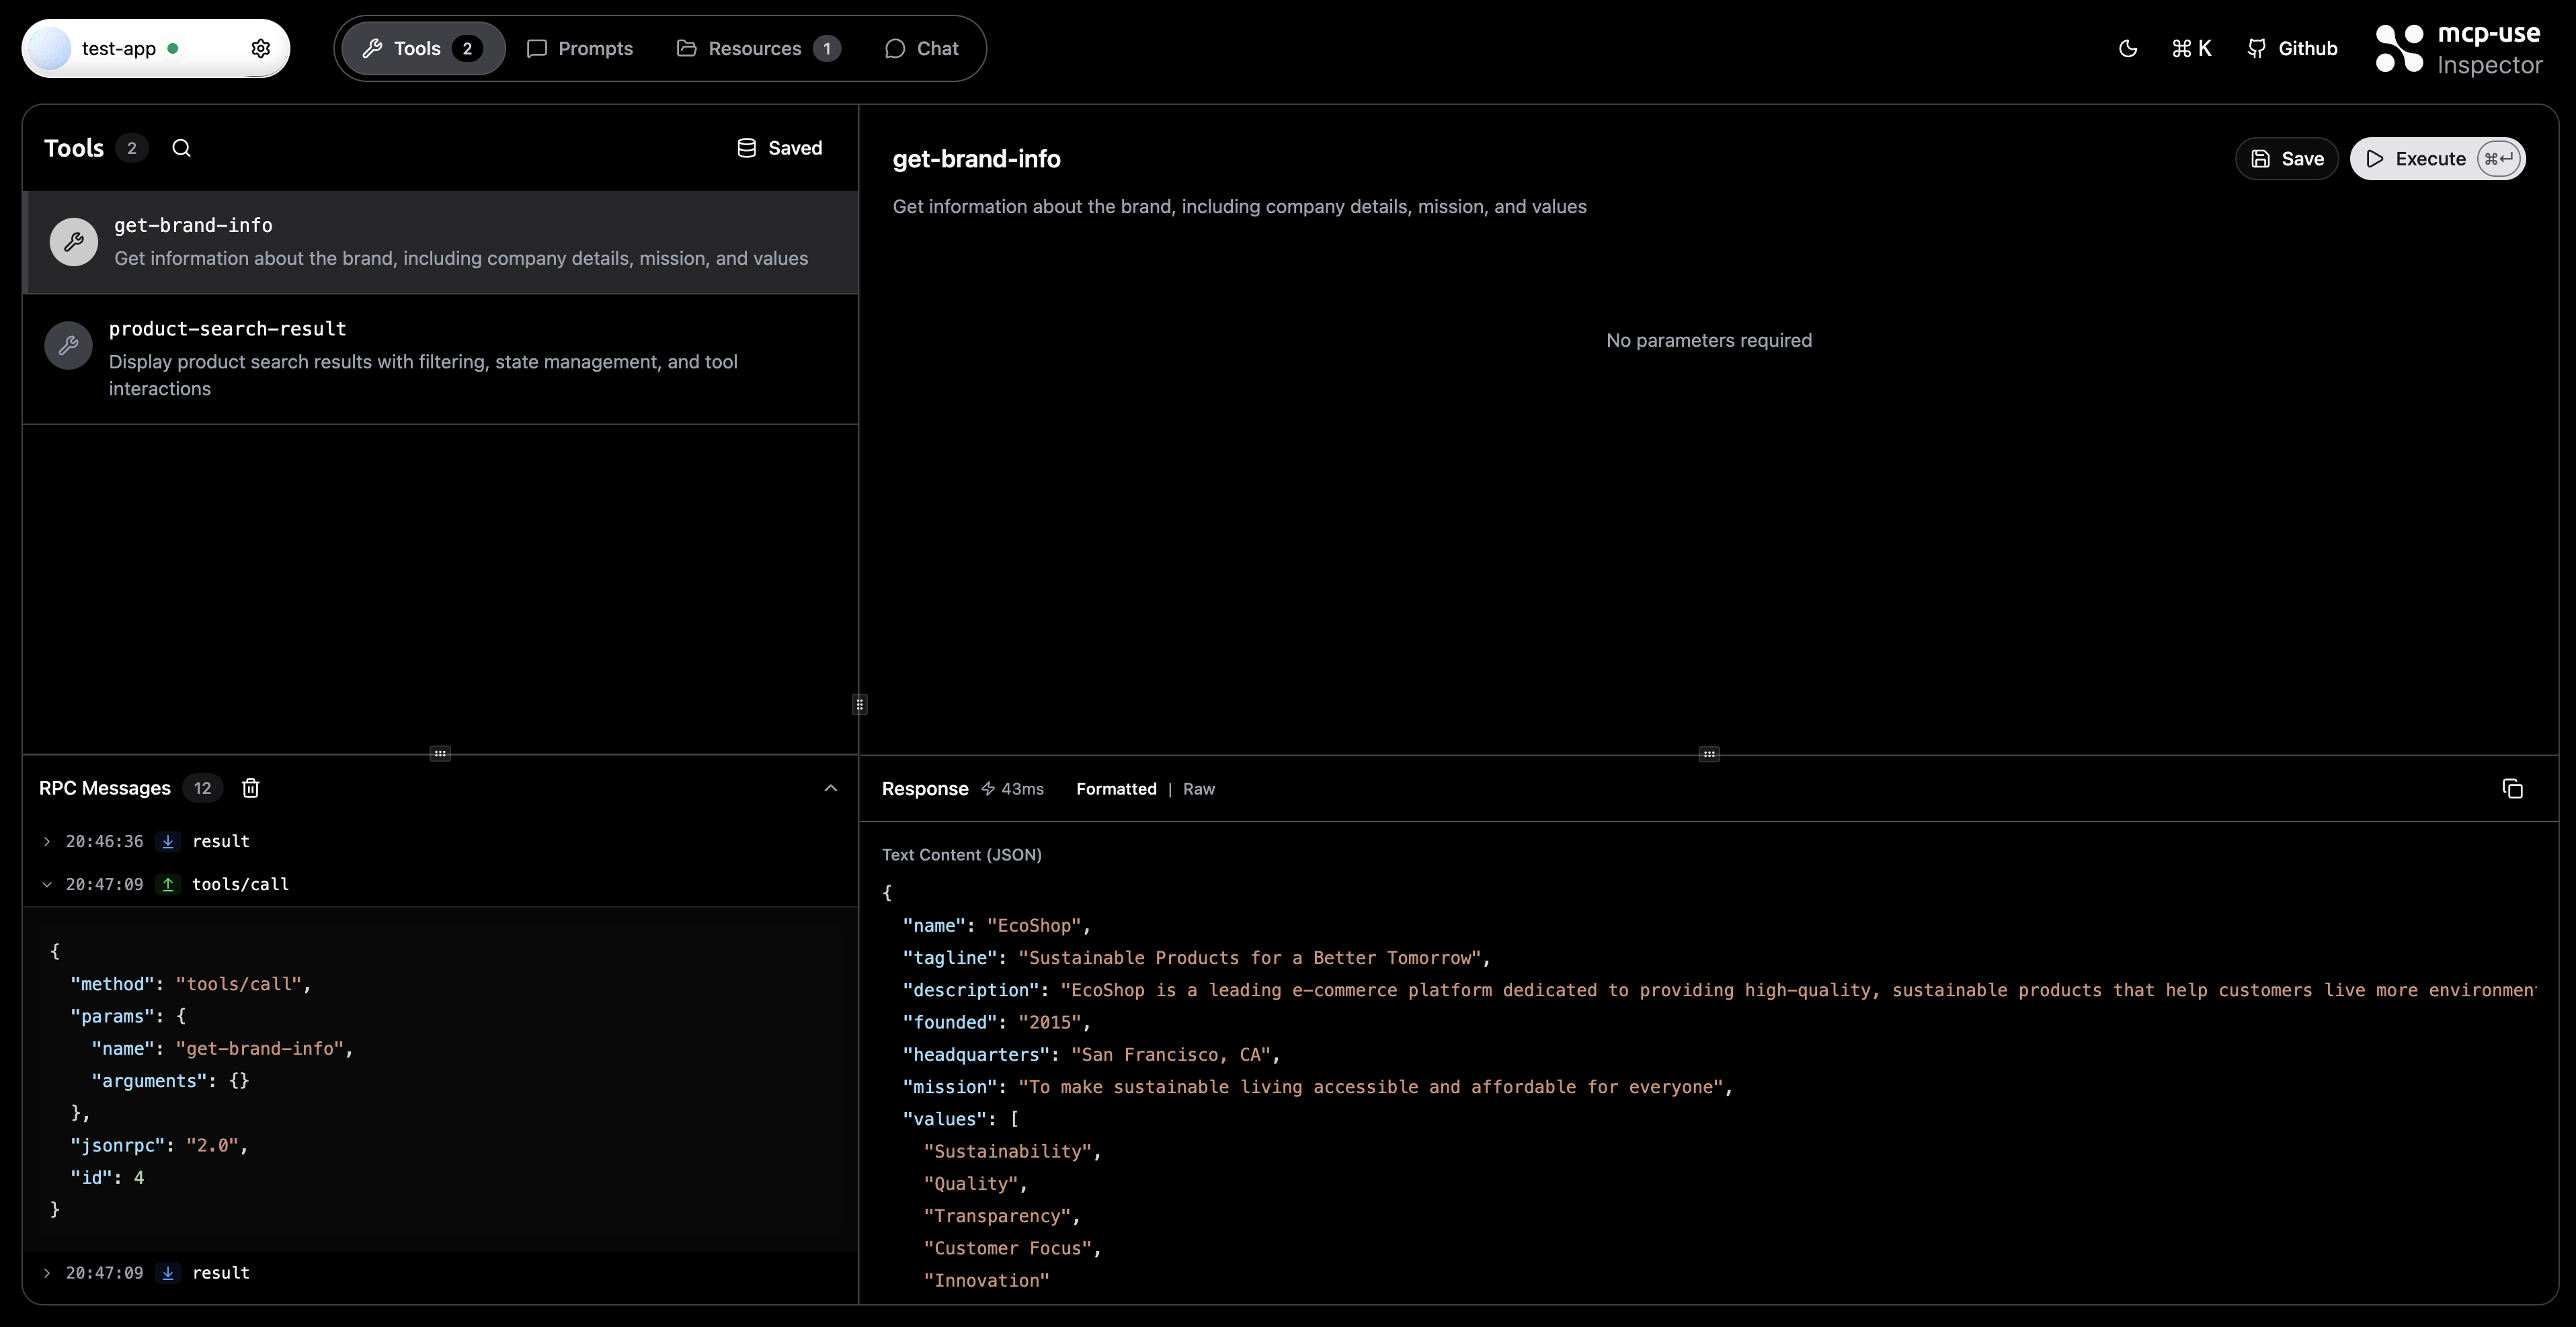
RPC Messages panel showing real-time JSON-RPC message logging
Understanding the Interface
Message List
Each RPC message is displayed as a row with:- Timestamp: Local time when the message was received
- Direction Badge:
- ↑ SEND - Outgoing messages from inspector to server
- ↓ RECEIVE - Incoming messages from server to inspector
- Method Name: The JSON-RPC method being called (e.g.,
tools/call,resources/read) - Expandable Content: Click to view the full JSON payload
Technical Details
Message Format
Each logged message contains:Related Documentation
- Tools Tab - Testing and executing tools
- Resources Tab - Browsing server resources
- Prompts Tab - Managing prompts
- Connection Settings - Server configuration
- Development - Inspector development guide