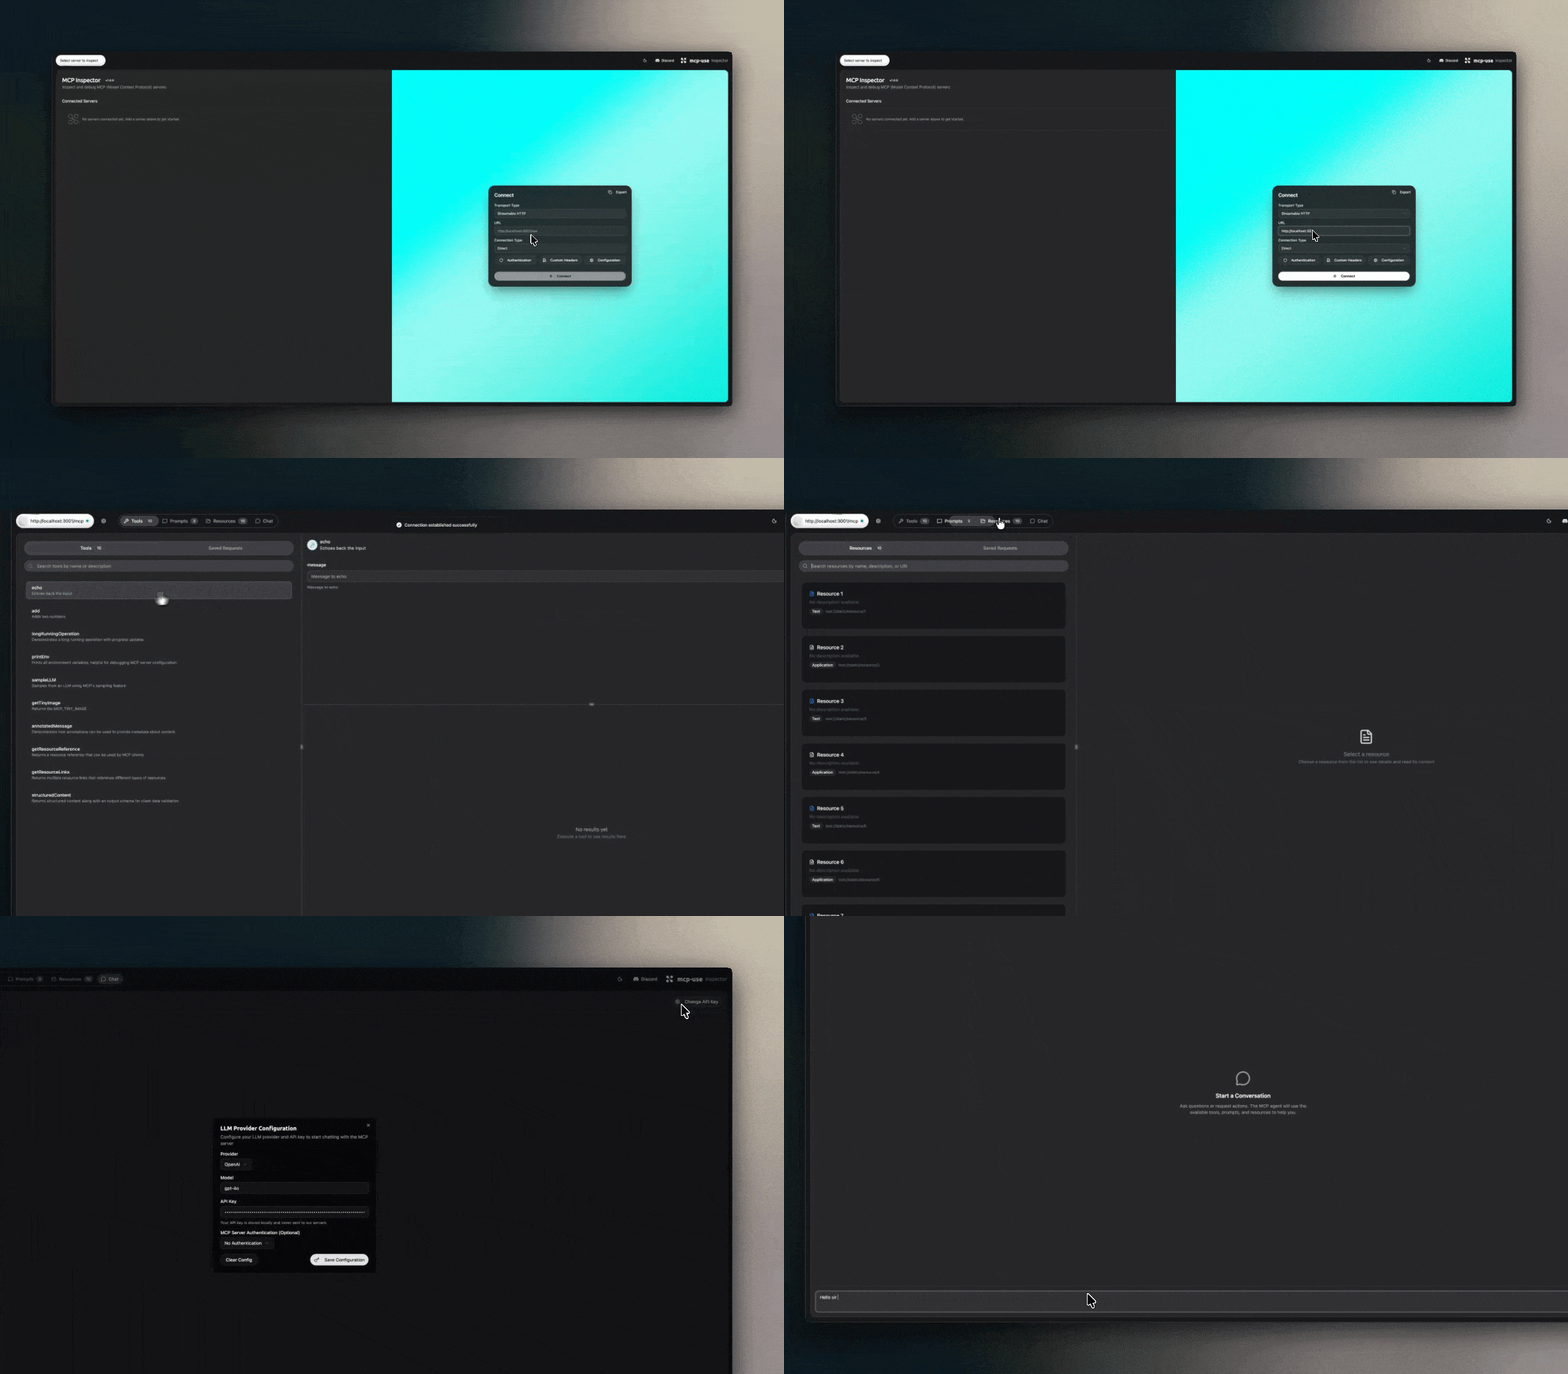
The mcp-use server framework includes a built-in Inspector UI, a web-based interface for real-time monitoring, debugging, and interaction with your MCP server. It provides a quick way to see server status, available tools, resources, and logs.
What is the Inspector UI?
The Inspector UI is a built-in web interface that provides real-time monitoring and debugging capabilities for your MCP server. It’s a visual dashboard that shows server status, available tools, resources, and logs. It also includes a BYOK (Bring Your Own Key) chat interface for interactive communication with your MCP server.Why Use the Inspector UI?
The Inspector UI makes it easier to:- Debug issues by seeing real-time logs and server status
- Test tools interactively without writing client code
- Monitor performance with live metrics and request tracking
- Explore capabilities by browsing available tools and resources
- Chat with your server using the built-in BYOK chat interface
Accessing the Inspector
Once your mcp-use server is running in debug mode, you can access the Inspector UI by navigating to the/inspector endpoint in your web browser.
For a server running on http://localhost:3001, the Inspector will be available at:
http://localhost:3001/inspector
Demo

Configuration
The Inspector UI is automatically enabled when running in debug mode and disabled in production. Configuration details will be documented once the implementation is complete.Next Steps
- Running the Server - How to run your server
- Configuration Reference - Complete configuration options
- Quickstart Guide - Build your first server


